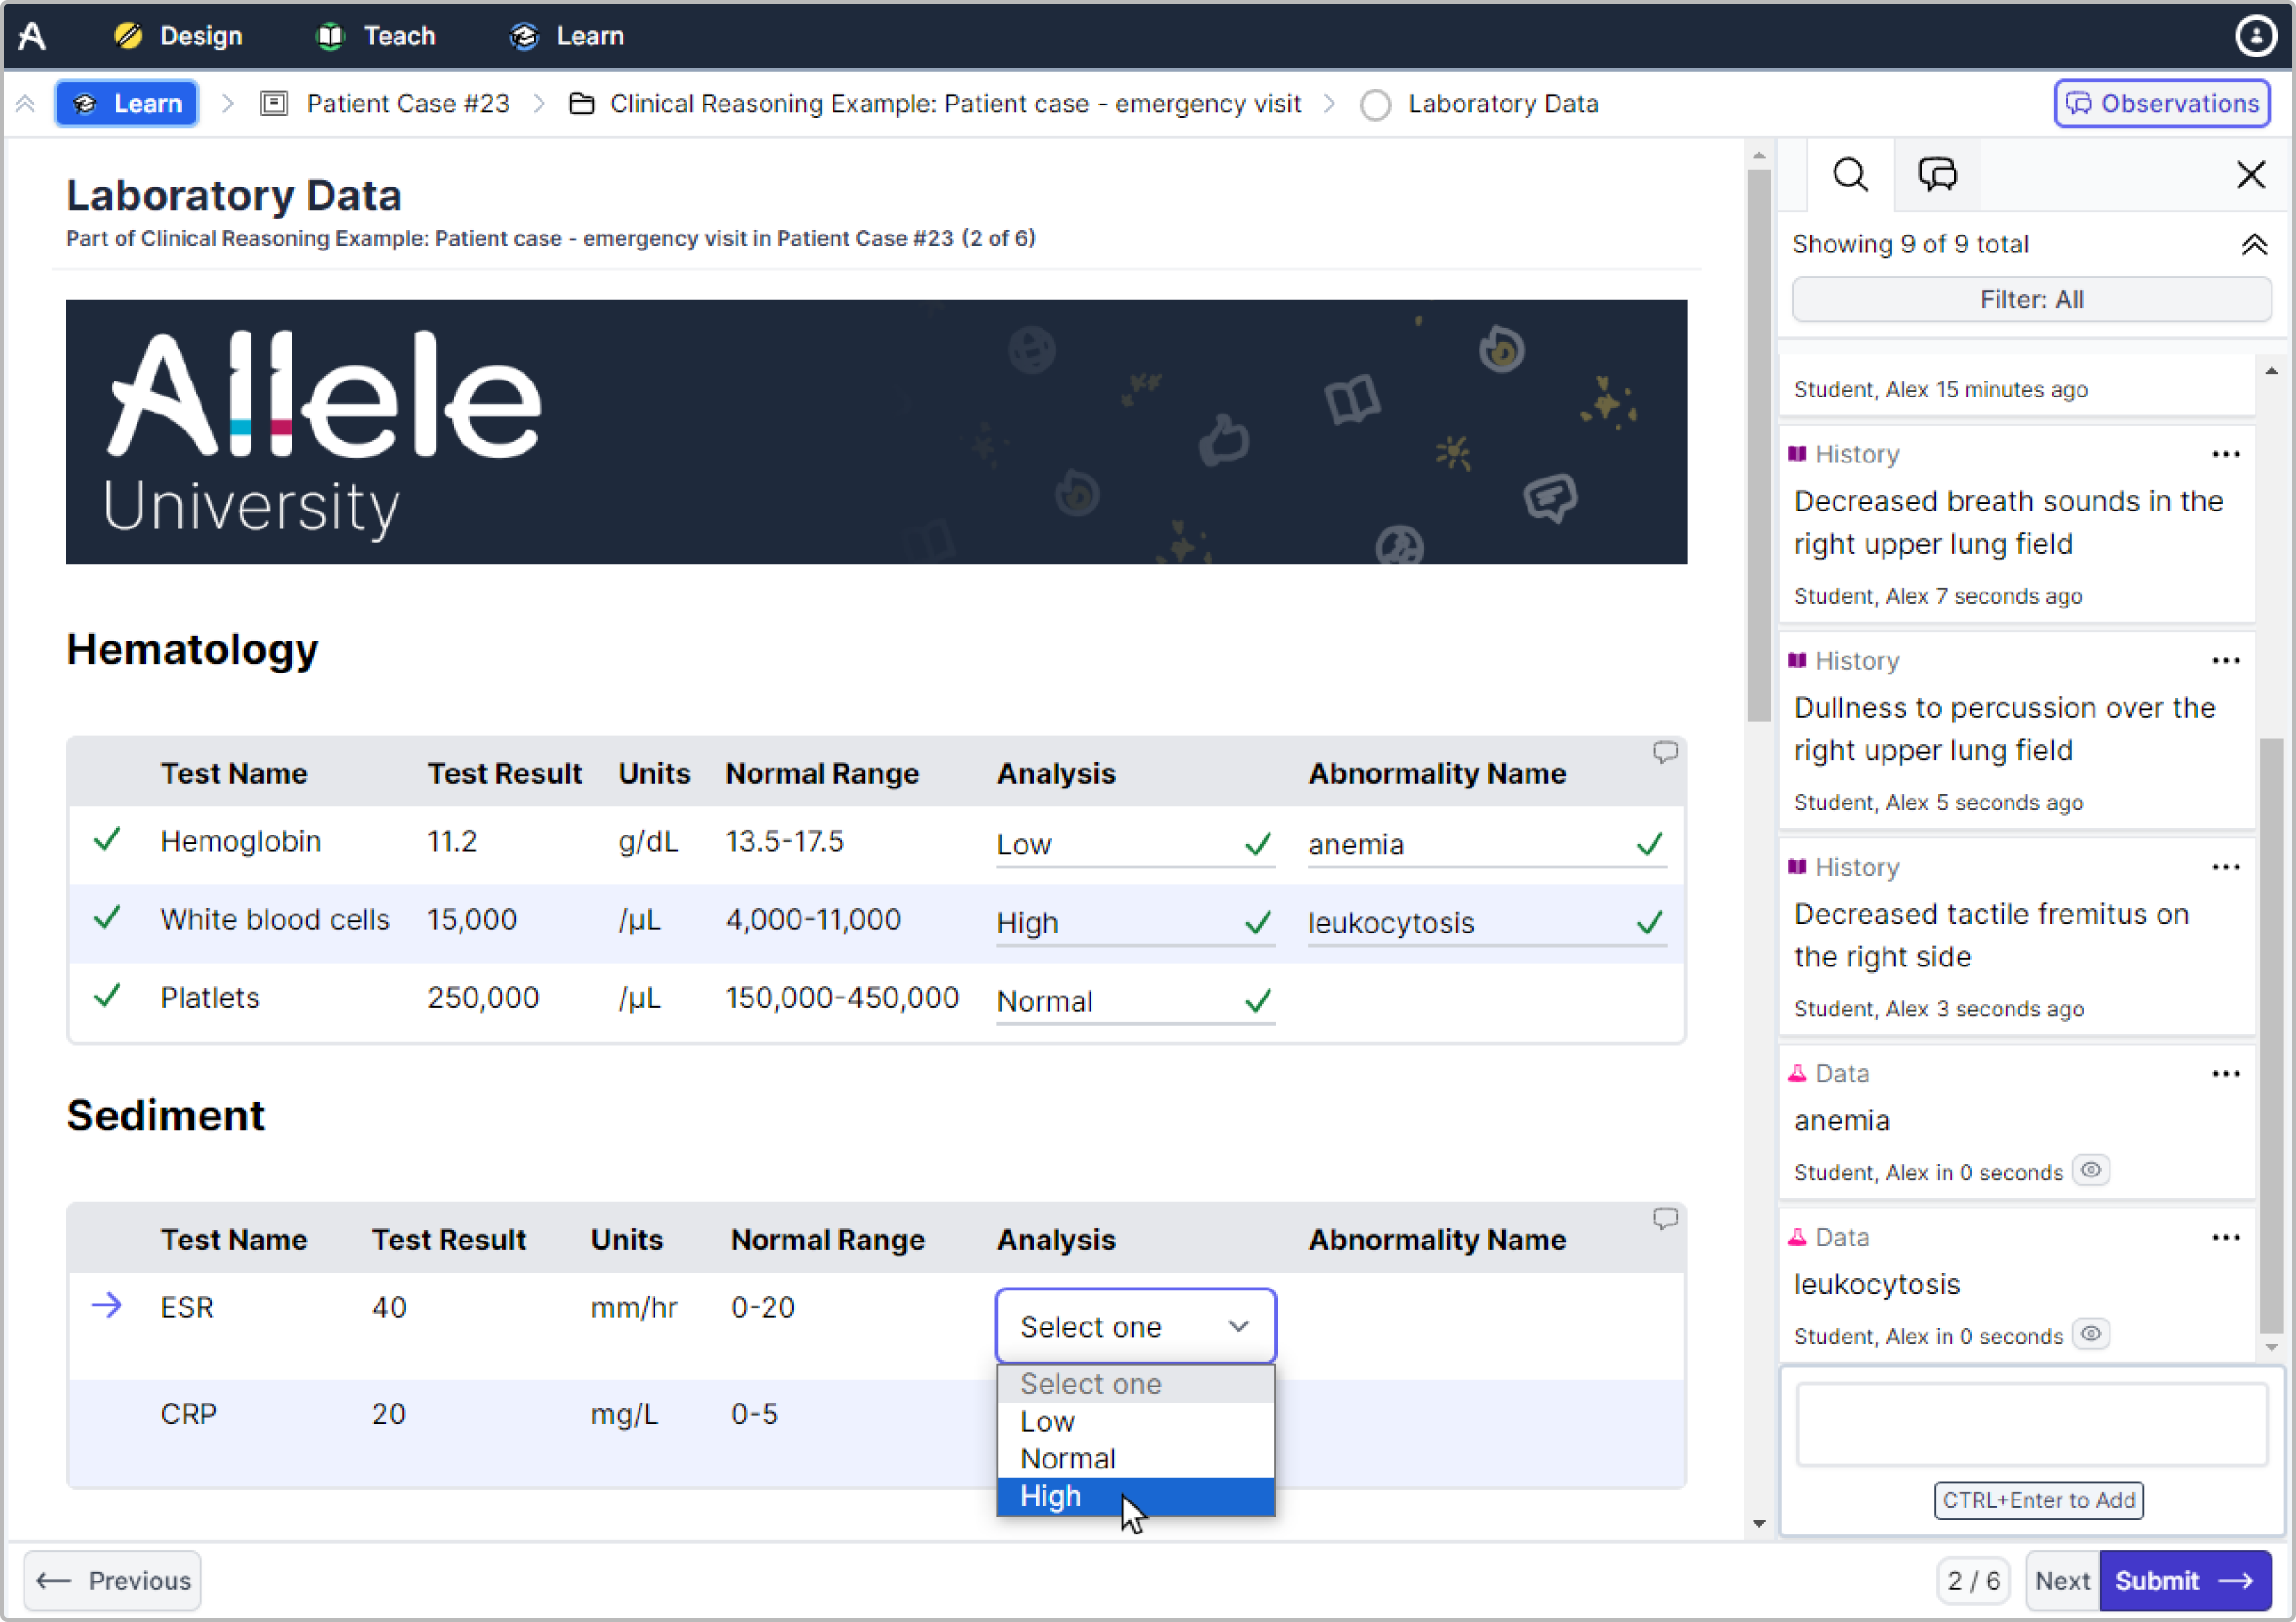
Lab chart
Flexibly present patient lab data. Enable students to assess results and identify abnormalities.

Fully customize the lab data table to your liking. Add custom columns, insert images into cells, and more.
Configure the amount of attempts students get to accurately analyze the result, as well as accurately identify the abnormality.
Configure multiple correct answers if synonyms exist, or if there is subjectivity in what is accurate.
When students correctly identify abnormalities, ‘data observations’ are automatically captured for future reference.
Did you know?
You can present different sets of lab data at different times throughout your course flow. Even though students will analyze the results at different times, all of the data abnormalities will be saved together in their observation list for later use.
